Reports, refreshed. More control over how your data appears.
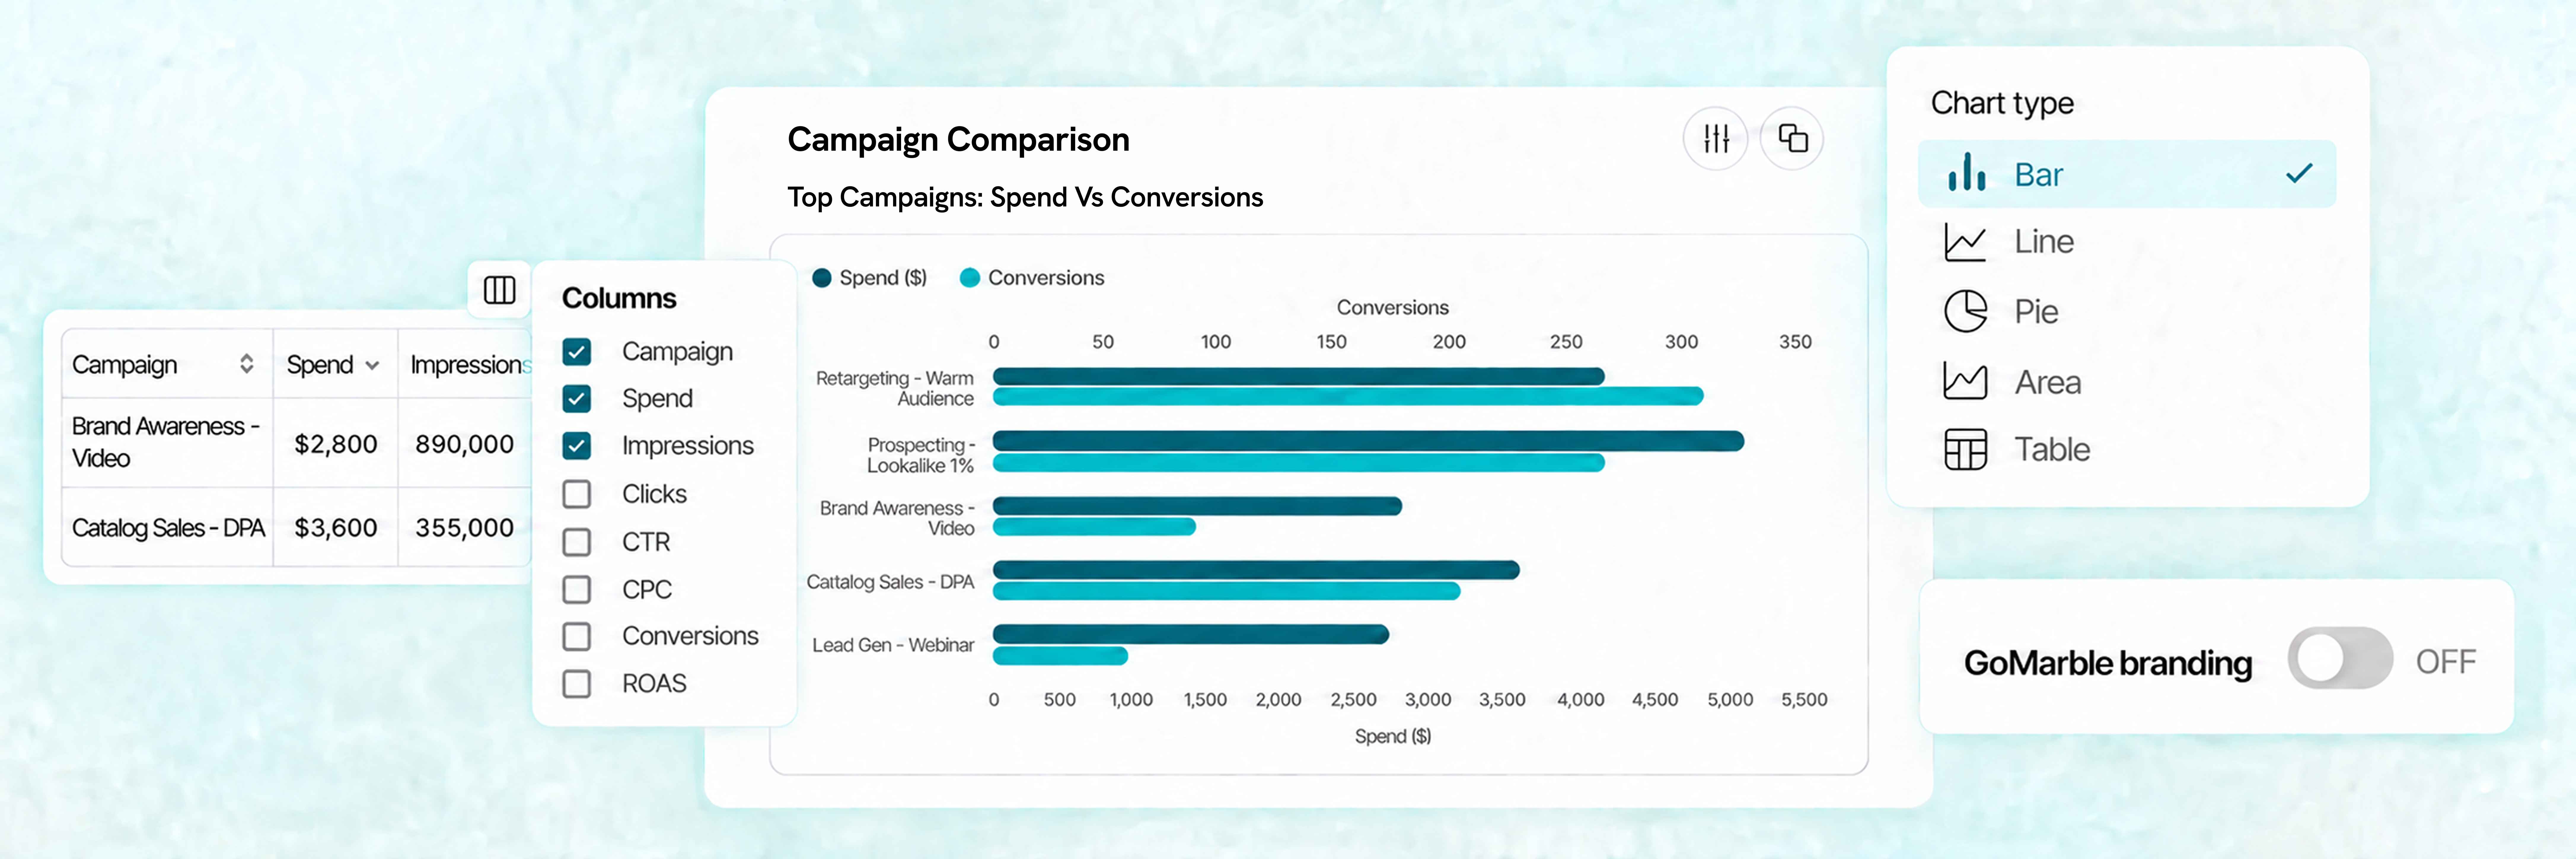
We’ve updated the Report Canvas in GoMarble easier to read, edit or customize — whether you’re exploring performance with your team or preparing an update for a client.
Here’s what’s new:
→ Charts you can shape: Switch between chart types—including bar, pie, line, area, and more—or turn a chart into a table. Preview the change and confirm it with Apply.
→ Tables you can customize : Sort, resize, reorder, or hide columns to show what matters. Copy charts and tables to use elsewhere, including in a spreadsheet.
→ Smoother saving: Save without the report refreshing or losing your place. Use the Save button or ⌘S / Ctrl+S.
→ Clearer reports: More consistent spacing, clearer charts, better-fitting tables, and simpler number formatting.
When sharing a report, you can also remove the GoMarble logo watermark for a cleaner, client-ready presentation.
The result is a report you can make your own, with less time spent formatting and more time spent on the insights.